5 ZenScore Widgets You Have to Use
The ZenScore Dashboard
When you’re managing a fleet, you are always looking for ways to improve your drivers driving habits, and look for savings in fuel costs and maintenance. ZenScore is very effective in doing that, and we’ll talk about how the dashboard will allow you to meet your goals with your fleet.
The dashboard is a feature within ZenScore that gives you a live display of your fleets driving performance, by showing the data in charts and graphics. The charts are fully customizable to your liking and can range from pie charts, line charts, and heat maps. These charts are referred to as widgets, and can be arranged on the screen as you prefer.
The dashboard can be displayed on a screen in your office, for drivers to see when they come in, and see how their fleets performing, or how they compare to other drivers. This will incentivize your drivers to drive better, and rank higher, especially if you run a contest.
Let’s review the top 5 widgets we think you need to be showing:
1. Incidents
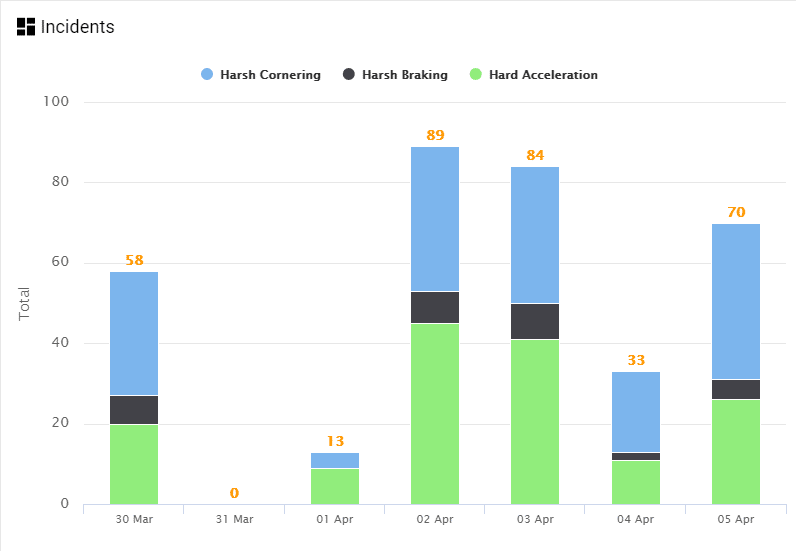
In the incidents widget, you are able to choose which rules you’d like “incidents” to represent, such as speeding or harsh braking. You are able to select up to 8 rules and decide what type of chart you’d like to use.
2. Top 10 Drivers
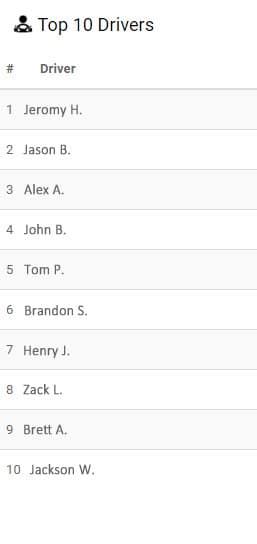
You can decide what 8 or fewer rules you want to select which will decide who the top drivers are. You may select idle time, harsh braking, speeding & hard acceleration, or any other rules you want to include.
3. Heat Map
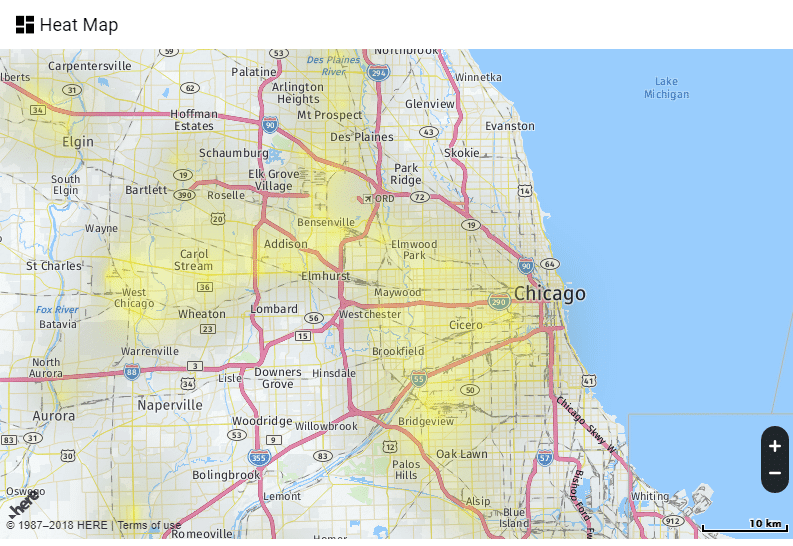
The heat map will show darker colored areas where the most rules are broken. The map is fully interactive, and the data will refresh frequently. This is a great way for you or your drivers to see where the problem areas are.
4. Driver Contest Top 10
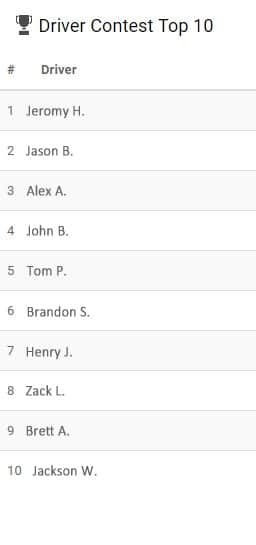
When you decide to run a contest, explained in our blog here, you can create a widget that shows the current standings of the top drivers, from 1 – 10. This is a great way to motivate drivers to win by improving their safe driving practices while saving you lots of money in the long run!
5. HOS Violations
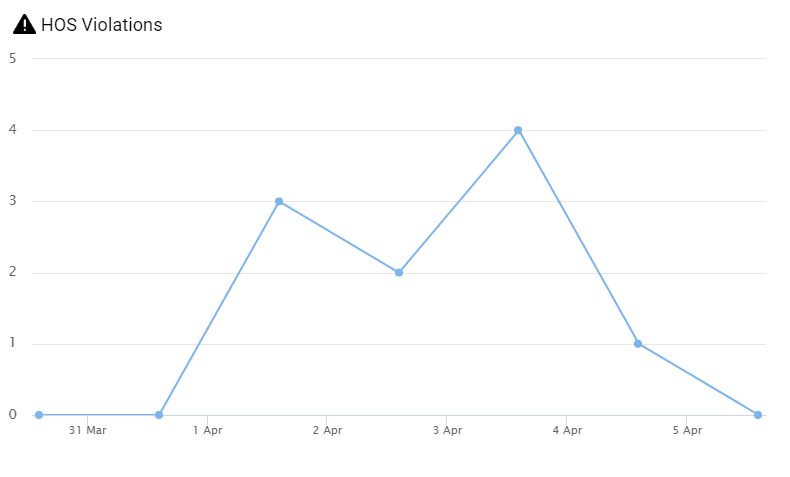
We know that tracking driver’s hours is very crucial to your business. Create the HOS Violations widget to see how many incidents there were per day. Tracking this is important for the safety of your drivers, and for protecting you from fines that can be up to $16,000 per violation.
Now that you know the top 5 widgets, start using them today to run a safer and more efficient fleet!