ZenScore: Fleet Dashboards & Behavior-Weighted Scorecards
Reduce liability with a powerful, easy-to-read driver dashboard. Review harsh-event trends and track every driver score on a clear fleet driver scorecard. Address safety issues with same-day coaching targets to stop accidents before your next insurance renewal.
Drive Fleet Safety and Performance

Full Fleet Visibility
The only dashboard that can provide full visibility into a fleet’s KPI progress while displaying the Live Map for real-time tracking.

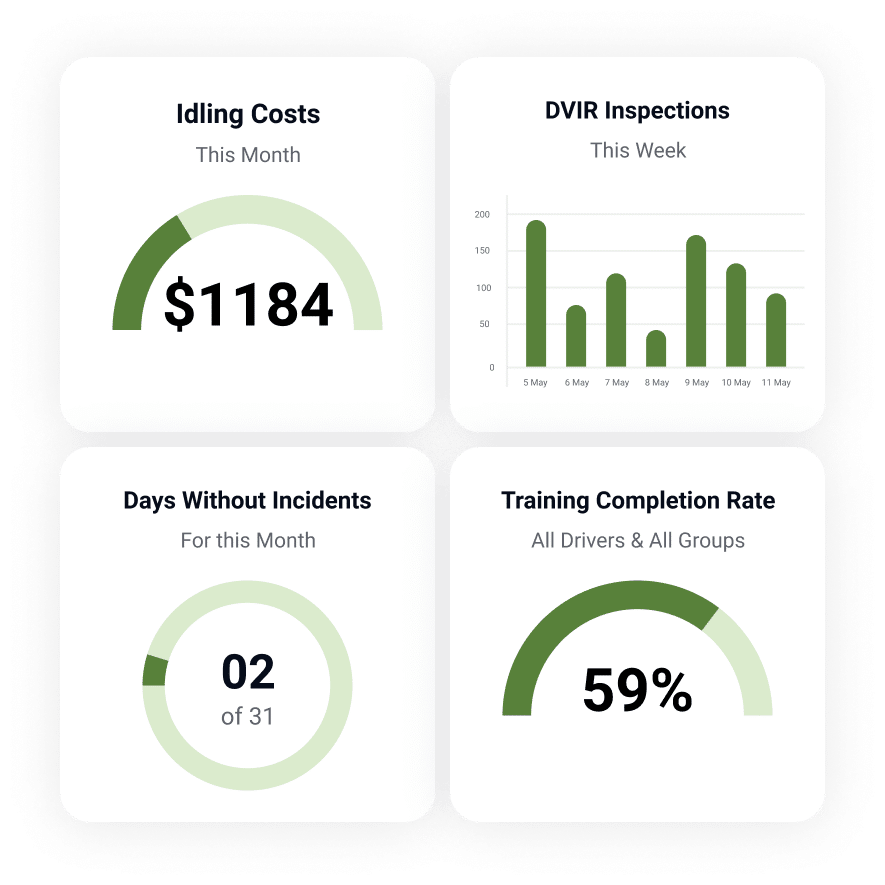
Extensive Safety Data
View important safety metrics that relate to compliance and identify risky driver behavior.

Make More Strategic Decisions
Identify drivers in most need of coaching so you can enhance coaching to help them improve safety and performance behind the wheel.
One dashboard for fleet KPIs, live tracking, and safer driving

Complete Visualization


Gamify Safe Driving
Monitor KPI Progress

Customize Your Dashboard
Email Report Function

How it works?
Here’s how you can run safety contests to encourage driver safety compliance.

Review your fleet’s safety performance through built-in or custom reports. Use it to see where your fleet can improve.

Start a Driver Contest where drivers can score points for good practices related to the metric you want to improve.

Analyze the results of the contest. Reward winners and assign training to those who need it.
More Features

Generate KPIs From Extracted Geotab Data
Extract Geotab data and generates key performance indicators to see how your fleet is doing on dashboards.
Consolidated and Convenient Management
Consolidate key Geotab features all in a single view, eliminating the need to toggle between numerous modules to view important information.
Segment Data By Group
Filter data between different vehicle groups and departments to gain greater visibility into the entire fleet.
FAQ
What is ZenScore KPI Dashboard?
ZenScore KPI Dashboard is an advanced performance management tool designed to help fleet managers track, analyze, and optimize key performance indicators (KPIs) related to their fleet operations. It provides real-time insights and comprehensive reporting to enhance decision-making and improve overall efficiency.
What are the key features of ZenScore KPI Dashboard?
- Real-Time Data Monitoring: Access up-to-date information on fleet performance metrics.
- Customizable Dashboards: Tailor the dashboard to display the most relevant KPIs for your operations.
- Comprehensive Reporting: Generate detailed reports to analyze trends and identify areas for improvement.
- Alerts and Notifications: Set up alerts for critical events and receive notifications to stay informed.
- Data Integration: Integrates with various fleet management systems for seamless data flow.
How does ZenScore KPI Dashboard improve fleet management?
ZenScore KPI Dashboard enhances fleet management by providing a centralized platform to monitor and analyze key metrics. This helps fleet managers identify inefficiencies, track performance, and make data-driven decisions to optimize operations and reduce costs.
Can ZenScore KPI Dashboard be customized to specific business needs?
Yes, ZenScore KPI Dashboard is highly customizable. Users can configure the dashboard to display the KPIs most relevant to their business, ensuring they focus on the metrics that matter most to their operations.
What kind of data can be tracked using ZenScore KPI Dashboard?
Fleet managers can track a variety of data, including fuel consumption, maintenance schedules, driver behavior, vehicle utilization, and more. This comprehensive tracking helps in gaining a holistic view of fleet performance.
How does the alert and notification system work in ZenScore KPI Dashboard?
The alert and notification system allows users to set thresholds for critical KPIs. When these thresholds are exceeded, the system sends real-time alerts and notifications, enabling managers to take immediate action to address issues.
Is ZenScore KPI Dashboard easy to integrate with existing systems?
Yes, ZenScore KPI Dashboard is designed for easy integration with existing fleet management systems. This ensures seamless data flow and enhances the overall functionality of the fleet management ecosystem.
What kind of support is available for ZenScore KPI Dashboard users?
GoFleet provides comprehensive support for ZenScore KPI Dashboard users, including setup assistance, troubleshooting, and ongoing technical support. Users can contact GoFleet support via phone, email, or live chat on the GoFleet website.
How do I get started with ZenScore KPI Dashboard?
To get started with ZenScore KPI Dashboard, you can contact GoFleet for a consultation. They will assist you in configuring the dashboard and integrating it with your existing fleet management systems.
What are the benefits of using ZenScore KPI Dashboard?
Using ZenScore KPI Dashboard helps fleet managers improve operational efficiency, reduce costs, enhance driver performance, and ensure regulatory compliance. By providing real-time insights and detailed reporting, it supports informed decision-making and strategic planning.