COVID-19 Recovery: Why Your Vehicle Data Is More Essential Now
The past few months have been an unsettling time for many workplaces as the COVID-19 pandemic has drastically affected businesses. Since this global pandemic started, Geotab recorded and reported on datasets to help fleets better understand the current landscape. As we are on the road to recovery, it is important for businesses to review how the commercial transportation sector is performing in relation to their own performance. Reviewing industry trends alongside personal vehicle data can allow fleets to make actionable decisions moving forward.
Below we use Geotab specific data that was updated on May 29, 2020, to help our readers better understand current commercial transportation activity, industry-specific activity, and fuel fill-up activity in relation to their operations.
Commercial Transportation Activity: A Slow Increase
With a baseline of February 2020 being used, it is clear to see in the image below that in comparison to the lowest dips in April 2020 (when many cities were in peak-response to COVID-19), there is a slow increase happening across the world. This is seen specifically in Canada, the United States, the United Kingdom and Australia. While there appears to be a rise and dip effect occurring, many view it to be a good sign that the dip does not last for long, as well that the rises are gradually increasing.
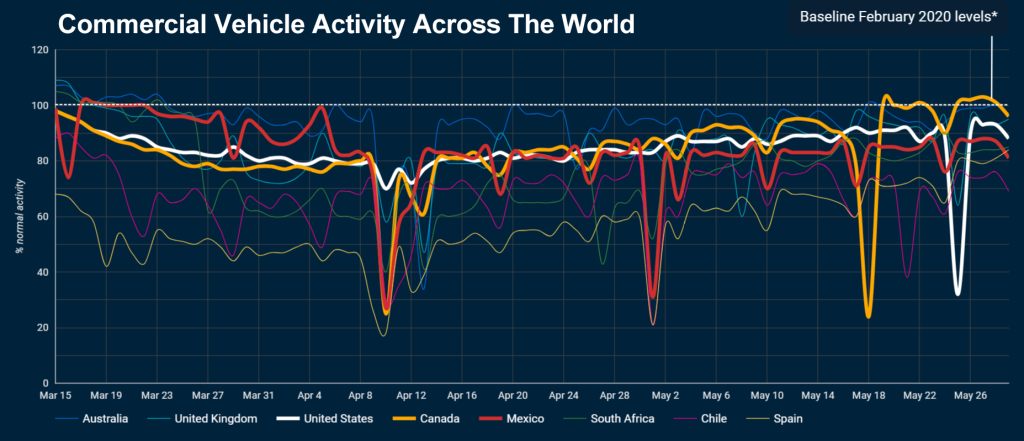
Source: Geotab
When speaking about the future, many believe that when businesses begin to reopen, their activity will drastically affect this graph. It is predicted that with more businesses reopening and requiring more inventory, stock or supplies, more vehicle use will occur.
Industry Vehicle Activity: What Is Happening During The COVID-19 Recovery
While the above graph may show positive signs that vehicle traffic is increasing, it’s important to note that it is not the case for all industries. Since February 2020, there are a number of industries where vehicle activity has not recovered as much as others in North America. These industries include non-freight transportation, healthcare services and business services. Many account this lack of recovery to be due to many unique businesses not reopening, or being unable to reopen to full-productivity. An example where this is visible is in the public transportation sector which has seen a continual decrease in activity as public transportation use is low (possibility as a result of the public not commuting to work as they are working from home).

Source: Geotab
Some industries to highlight that are steadily increasing are construction, government, freight transportation, retail and telecommunications. This slow increase is typically due to the reopening of many businesses that could no longer hold off operations and were approved by governments to slowly reopen. For example, within the construction industry, the longer work was paused, the longer the delays for construction to be completed. When speaking about condo developments or other development projects, many companies could not financially afford to hold off construction due to financial and contractual responsibilities to home buyers.
Fuel Fill-Up Activity: What Increases Can Mean
In North American the vehicle telematics data gathered by Geotab confirms that fuel fill-ups of varying larger-sized vehicles are increasing. The data shows that since the end of April, there has been a noticeable increase in the usage of LDT (light duty trucks) and MDT (medium duty trucks) vehicles. This is likely in accordance with traffic increases for industries who are looking to resume operations. It is important to note however, that there are some vehicles such as MPV (multi purpose vehicle), passenger and bus that may not see such increases in fuel fill-ups until there are less restrictions on public contact and public outings. The steady increase in varying industries is important to monitor because it allows for vehicle-based businesses to see how their specific industry is performing overall.
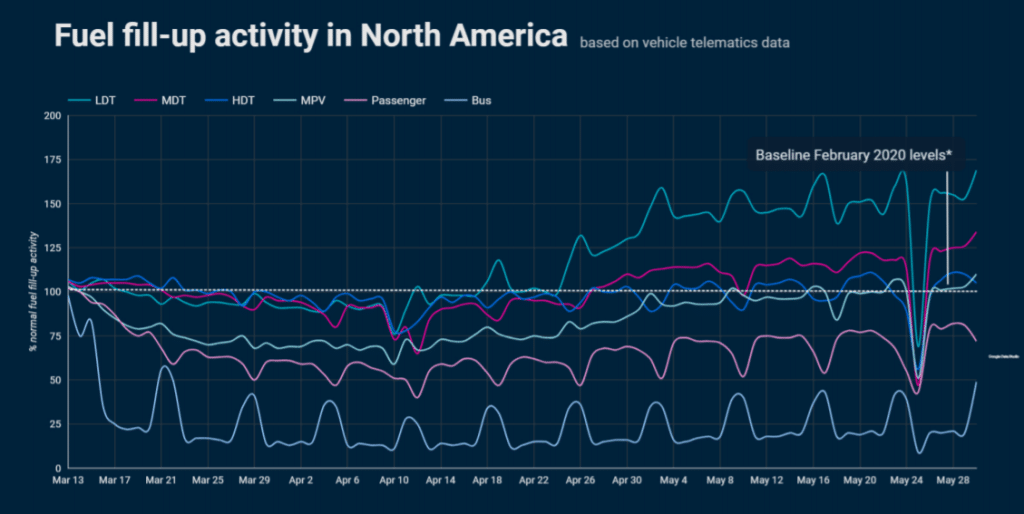
Source: Geotab
What Your Vehicle Data Means
Properly Collecting Data
With all of this information available, it’s important for businesses to use it to their advantage. Specifically, by reviewing the vehicle telematics data of their own business in accordance with industry competitors. By using telematics solutions businesses are able to review current operations and see whether their organization is on par with industry trends.
Collecting Your Own Data
In order for businesses to truly see results from the data gathered by Geotab, there must be processes in place to collect information related to their fleet. If no solutions are currently in place, or businesses are unsure about what should be used, the first step is to use a GPS tracking device like the GO9. For the purpose of this discussion, the GO9 can be used to record the GPS location of vehicles and depict usage within detailed reports. As well, it allows for easy add-on hardware through an IOX expansion port to allow for future tracking of HOS ELD, auxiliary, temperature monitoring as well as other third party monitoring solutions.
![]()
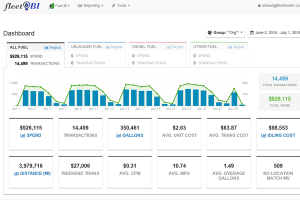
An additional tool to use to properly measure against the industry trends mentioned above, is to implement a fuel card integration. Using a tool like FuelBi allows fleets to better track the fuel fill-ups of company vehicles. While the device initially focuses on tracking and visualizing important fuel KPI’s and transactions, it is also used to monitor how frequently company vehicles are being filled. This directly shows the usage of company vehicles.
![]()
Comparing Company Data To Industry Data
When businesses reach the point that they have accumulated enough data to properly view how their fleet is performing, it can then be compared to the industry trends above. After reviewing the data in accordance to current industry trends, business owners and managers are encouraged to adjust their operations accordingly. What this means is that if businesses see that they are performing at a lower rate than their industry, they need to research why. Sometimes a lack of operational customers or possibly a decrease in availability of your team are the answers. As there are various reasons for why your business may not be recovering from the COVID-19 pandemic at the same rate as competitors, it’s important to work with professionals who can point out why this may be happening and offer solutions that drive results.
Interested in working with a team who can help? Contact GoFleet today. Our team is experienced in data analyzation and consultation as our goal is to have every customer outperform their competitors.